
The page you were trying to view is not available for your role and region.
The Q2 reporting season is now largely complete. And what a season it has been with the main US market clocking up the highest earnings growth rate since Q2 2021 on a year-over-year (YoY) basis. The headline numbers speak for themselves:
- 86%* of companies beat earnings expectations
- 76%* of companies beat on revenues
With numbers like these it’s no surprise that, when it comes to the 2026 Q2 earnings season, all eyes have been on the US. But what about other regions, specifically Europe? After all the US does not have a monopoly on forecast-busting companies. For their European peers have been getting in on the act too. So much so, Q2 EPS (earnings per share) growth in Europe has been the strongest in nearly four years.
But how do the two regions compare and what does the latest reporting season tell us about what Europe has to offer investors?
The scorecard
As of 14 August 2026, 83% of companies listed on a leading European index had reported their Q2 results. Of these, 54% had posted positive earnings surprises while another 10% had reported in line results. Not US levels, but a strong outcome nevertheless. What’s more, that strong European Q2 performance is no one-off as, according to FactSet, the beat rate matches the post-2012 average. True, at 4.8% the mean positive surprise is slightly off the historical average of 5.9% and way off the US’s 29.2% for the quarter. But strip out the mega beats achieved by the mega caps Amazon and Alphabet, which included unrealised investment gains, and the percentage by which US companies reported above consensus earnings drops to 10.9%. Still above Europe but no longer a million miles away.

Encouragingly, the European beats have been broad based (as has been the case in the US) with technology leading the way, closely followed by healthcare, financials and energy. Soft spots have largely been confined to companies in the consumer discretionary, consumer staples and telecommunications sectors.
There could be more to come. In their accompanying commentary, management teams have generally talked about strengthening demand and resilient margins. No surprise then that upwards earnings revisions have accelerated and are even closing in on those seen in the US. In short, Europe’s earnings season has been a good one. That said, there’s no getting away from the fact that when it comes to earnings comparisons, that’s one to the US.
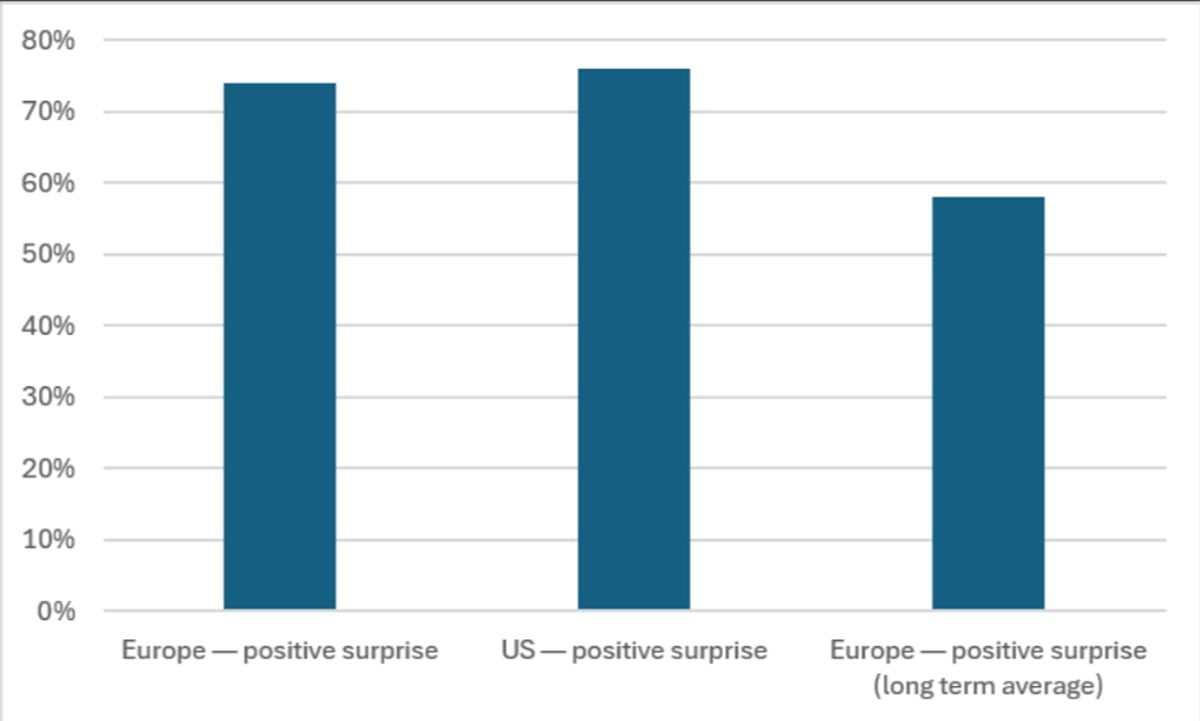
Earnings are just one part of the equation. Revenues, the other. Here the European numbers are more impressive with 74% of companies reporting positive surprises. That’s a step-up from the long-term average of 58% and just a hop and a skip from the 76% of US companies that have reported revenue beats. As for by how much companies have been beating, the mean surprise stands at 2.7%, double the historical average of 1.3% and not far off the 3.2% reported by US companies. At the sector level, European industrials lead the way followed by technology, healthcare and basic materials.
Q2 revenues for European stocks have delivered a similar level of positive surprises as the US and comfortably above the long-term average
Source: FactSet, Quilter Cheviot Limited, 14/08/2026. Past performance is not a reliable indicator of future returns. The value of investments and the income from them can go down as well as up. You may not recover what you invest.
Europe within touching distance of the US in terms of positive revenue surprises but not close enough to prevent another notch for the US. Two-nil to the US.
A US slam dunk?
Not quite. While the strong earnings and revenues reported by European companies might not have matched the dizzying heights seen in the US, Europe does appear to have an ace up its sleeve. Valuations. Despite the stellar numbers posted by US companies, the forward 12-month price/earnings (P/E) ratio for the MSCI North America index currently stands at around the 20.0x mark. As the graphic below shows, that’s comfortably above the 30-year average. And remember that 12-month forward P/E ratio is dependent on those stellar earnings forecasts coming in. The MSCI Europe ex-UK index meanwhile trades at a 12-month forward P/E of 14.9x, in line with the 10-year average and comfortably below that of the US.
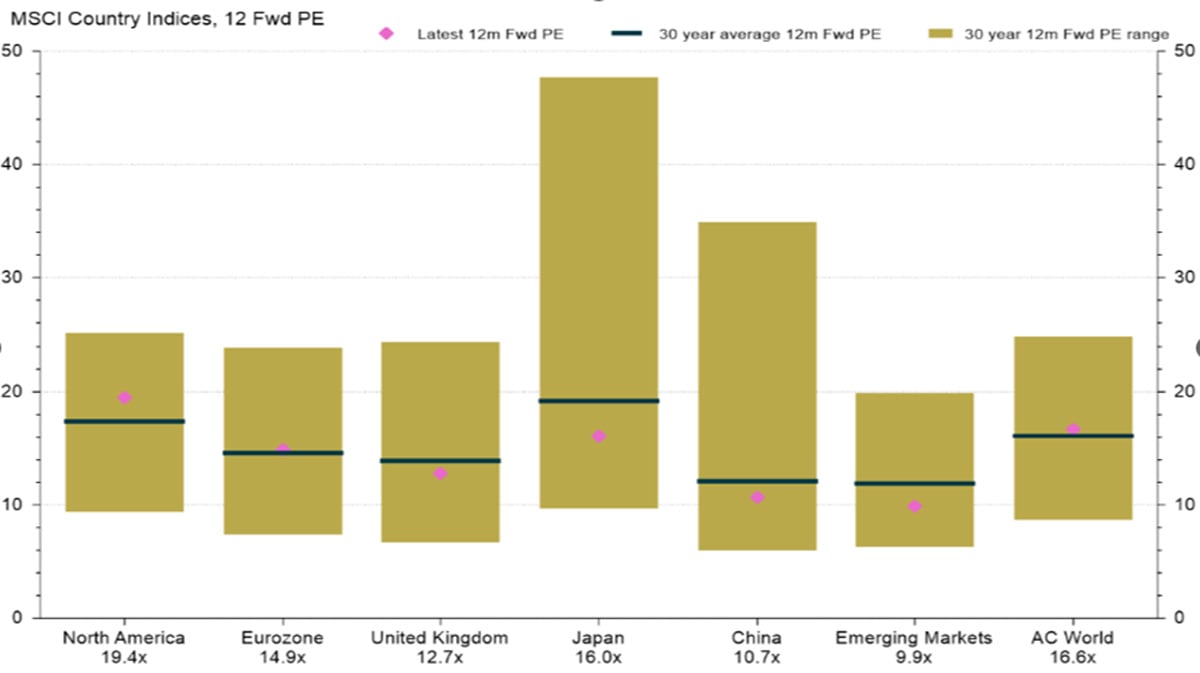
Source: LSEG Datastream, Quilter Cheviot Limited, 06/08/2026. Past performance is not a reliable indicator of future returns. The value of investments and the income from them can go down as well as up. You may not recover what you invest.
Now arguably ‘twas ever thus’ that the US trades at a relatively high multiple and for good reason too (just look at that Q2 performance). Still when it comes to valuation that’s a score for Europe.
2-1 to the US.
A late equaliser
The US though has a concentration problem. After years of outperformance and thanks to a growing cohort of US$1tn companies, the technology sector currently accounts for around 38% of the main US market. The equivalent figure for Europe is 8%. Technology isn’t even the largest sector in the European index, industrial goods and services is. Even then its weighting stands at a relatively modest 15.2%. As the Q2 numbers demonstrate, Big Tech has a big influence on the overall US reporting season (remember if Alphabet’s and Amazon’s numbers are stripped out the percentage by which US companies beat earnings expectations drops to 10.9% from 29.2%). In terms of concentration risk then, Europe wins hands down. Another score for Europe. 2-2.
Call it a draw then. And that’s the result we want to see. After all, when building and running diversified portfolios, investing in assets and markets that have their own unique set of drivers and fundamentals, strengths and weaknesses is key to managing risk and optimising returns. That’s why it often pays to look beyond the headline grabbers and seek out other, perhaps less-covered stories to capture the benefits of diversification.
* based on the 88% of US main market companies that had reported by 7 August 2026—source FactSet
Author