It is worth comparing the current energy shock with similar crises in the past. For example, the 1973 oil shock resulted in an approximate 5mbpd cut in production. Back then, this represented around 10% of global oil output which led to a near quadrupling of oil prices for a six-month period. Whilst the order of magnitude of today’s cuts (so far) is similar at around 10% of global oil production, the oil price is only 60% higher. Countries have a wider range of energy sources today and oil intensity in economies is also less today than it was in the 1970s but, despite this, hydrocarbons are more prevalent and overall oil production and demand is greater. Around one third of global energy demand comes from oil, and about one quarter from gas.
The impact on global growth and inflation
It is looking more likely that higher oil prices will prevail for longer than the market had originally anticipated, but how long and at what level are key to the impacts for growth and inflation and therefore financial markets.
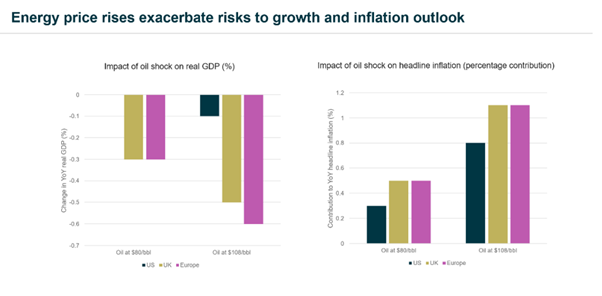
As a rough ballpark, to give some context, assuming USD80/bbl oil prices are sustained for a period of 3-6 months and all else being equal (which it's not!), growth impacts would still be manageable with the hit to UK and European GDP growth for the year limited to 0.3% and no impact on US growth. Similarly, USD 80/bbl energy prices could see inflation 0.5% higher in Europe and the UK with a 0.3% uptick in the US as a result of first-order impacts—once again unwelcome but manageable.
Source: Bloomberg Economics, Quilter Cheviot Limited, 2/3/2026. Past performance is not a reliable indicator of future returns. The value of investments and the income from them can go down as well as up. You may not recover what you invest.
Oil at US$108 for a sustained period could however impact UK and European growth more meaningfully with Europe potentially suffering a 0.6% reduction, a halving of the 1.2% annual GDP growth previously pencilled in; in the UK GDP growth could be 0.5% lower; while the US could suffer only a minor 0.1% hit. Meanwhile first order impacts may see inflation 1.1% higher in both the UK and Europe and 0.8% in the US, once again a more meaningful impact.
There are additional effects from the Strait of Hormuz closure to consider too. Already we are seeing rises in the price of fertiliser which will likely add to second order effects of higher food cost inflation—over a third of global exports of urea, a nitrogen fertiliser, passes through the Strait of Hormuz, according to the Financial Times.
In line with this and with oil prices currently above the US$100 level, official forecasts are beginning to reflect the negative impact on growth and inflation. In the Eurozone, the European Central Bank now expects inflation to hit 2.6% in 2026 compared to 1.9% in December and has lowered its forecast for growth for the year to 0.9% from 1.2%. In the UK, inflation is also expected to come in at 2.6%, comfortably above the 1.9% the Office of Budget Responsibility had predicted in early March.
However, what is important is that inflationary spirals do not follow. Inflation expectations are key here and these remain well anchored. Using the 5-year UK index linked bonds breakeven expectations as a proxy for inflation expectations, this has currently moved from 3.1% to 3.7%, which suggests expectations are still contained. In 2022 it reached 5%.
The current state of play
As the global picture has evolved, asset classes have behaved as one would expect. Global equities, as mentioned earlier, have given up their YTD gains and are now sitting on low-single digit losses for the year; while government bonds yields have risen too—the 10-year Treasury yield is up 18 basis points YTD to 4.35%; the 10-year German Bund yield 15 basis points higher at 3.01%; and the 10-year UK gilt yield 44 basis points higher at 4.92%.
The conflict has seen a reversal in fortunes for the US dollar with the greenback up 1.5% against a basket of currencies as represented by the Bloomberg $ index having lost ground to most major currencies prior to the outbreak of the war.
Gold too has suffered a reverse—the price had fallen 16.2% in sterling terms since the outbreak of the war, pushing YTD performance down to +2.4%. The combination of the stronger dollar (gold is priced in dollars so to counter a rise in the US currency, gold prices fall), the prospect of higher inflation resulting in higher interest rates and investors selling to bank gains made in the precious metal are all at play here.
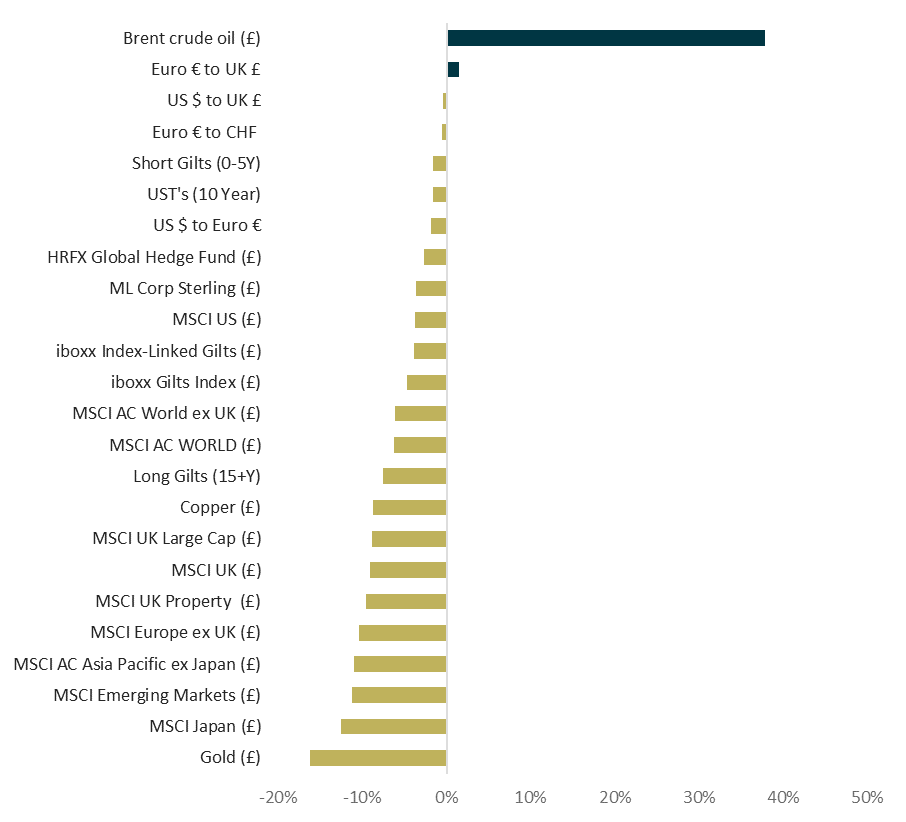
Market snapshot since the Middle East conflict began
 Source: LSEG Datastream, Quilter Cheviot Limited, 23/3/2026. Past performance is not a reliable indicator of future returns. The value of investments and the income from them can go down as well as up. You may not recover what you invest.
As you can see from the bar graph above, there has been a broad risk off move with negative returns from many asset classes since the war began. However any readers feeling uneasy at some of these numbers should remember, the power of diversification still works, even in markets that are declining. For example, a balanced portfolio model will currently only be down low single digits returns YTD.
Lessons from history: Beware initial market moves
Markets move quickly to price in adverse reactions. These are often then faded out over time as other options become more possible and responses and reactions come into play. In line with this, and as the chart below shows, stock markets have still made positive progress when oil prices were trading at US$100 or above. Clearly other factors are involved, and no two oil-price shocks are the same, but since the turn of the century, oil has traded above US$100 for large periods of time and yet, stock markets have, after initially retreating, resumed their upwards trajectory.
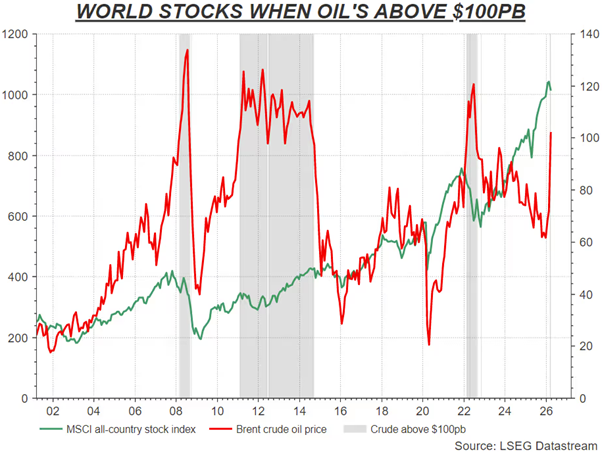
Source: LSEG Datastream, Quilter Cheviot Limited, 18/3/2026. Past performance is not a reliable indicator of future returns. The value of investments and the income from them can go down as well as up. You may not recover what you invest.
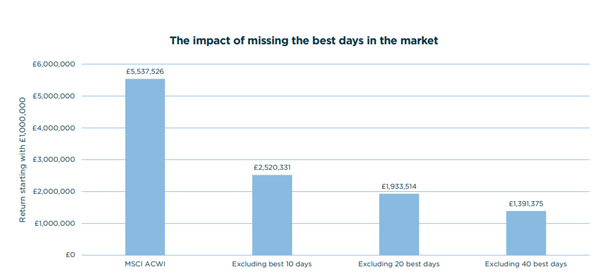
History also shows that although equity sell-offs can be worrying at the time, typically it pays to remain invested. As the chart below highlights, whenever global equities have down years, the final calendar-year return has always been higher than the intra-year decline.
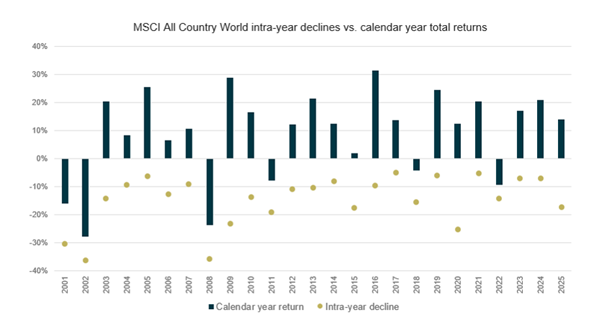
Source: LSEG Datastream, Quilter Cheviot Limited, 31/12/2025. Past performance is not a reliable indicator of future returns. The value of investments and the income from them can go down as well as up. You may not recover what you invest.
Remember stock markets enable investors to benefit from the growth in businesses and the wider economy over time. With that in mind, it is worth noting that prior to the conflict, consensus earnings per share growth forecast for the MSCI ACWI stood at +14.6% for 2026 compared to the 11.3% growth seen in 2025. This was driven by the decent global GDP growth backdrop and inflation that was gradually normalising. Even though this figure does not take into account the effects of the war, the consensus number is at least starting from a decent place.