
The page you were trying to view is not available for your role and region.
‘Bond markets resume sell-off after strong US data’; ‘A “vicious loop” of selling grips government bond market’; ‘Bond sell-off deepens and oil rises as Iran-US deal hopes fade’—just some of the headlines run by the Financial Times recently. But what are the numbers and drivers behind the headlines? And what do yields hitting 20+ year highs mean for investors?
The numbers
At the start of October, the 10-year US Treasury yield, arguably the single most important number in financial markets owing to the key benchmarking role it plays for a wide array of financial products and securities—think mortgage pricing and stock valuations—hit 5.34%. That’s the highest level in almost a quarter of a century. Ditto, the 30-year note which a day earlier saw its yield hit 5.64%.
It’s not just a US phenomenon. At 5.44%, the yield on the 10-year UK gilt too reached 20+ year highs. Similar story with the 30-year gilt— in early October, the yield topped 6% for the first time since 1998. Meanwhile, the yield on France’s 10-year government bond reached levels (4.96%) not seen since 2002. And in Japan, the 10-year yield (3.1%) traded close to multi-decade highs.
A little perspective
With records tumbling, it is easy to see why rising yields have hit the headlines. But what matters most for bond returns is the rate of the change seen in yields. Take the 10-year gilt. In the first nine months of 2026, the yield rose by 0.96 percentage points (0.96%) to 5.44%. That translates into a -2.4% return. As for the market as a whole, gilts have generated a -2.8% total return for the year to 30 September (the loss is slightly larger due to longer-dated bonds falling more due to their increased interest rate sensitivity). Both are losses, but they are manageable ones especially when compared to losses that can happen in equity markets from time to time.
What’s more higher starting levels now provide a potential cushion for the future. Rewind to the start of 2022, when the 10-year gilt yielded 1%. A 0.96 percentage points rise from there would have generated a total return of around -6.4% — more than double the -2.4% return above.
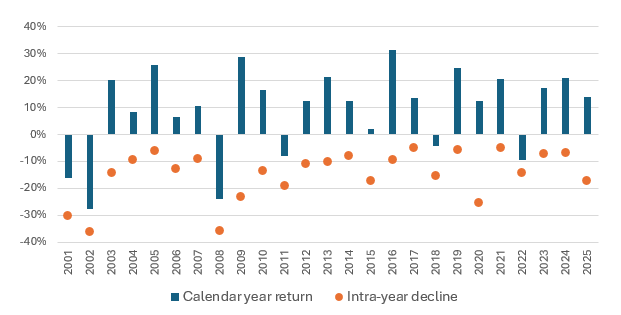
And bearing in mind this has been an understandably difficult year for fixed interest, it’s worth looking at how these total returns (-2.4% and -2.8%) compare to equity markets when they are going through challenging periods.
Chart#1: The MSCI All Country World index has experienced an intra-year decline in excess of 10% in 15 of the last 25 calendar years, although on only three occasions did the index end the year down 10% or more
Source: LSEG Datastream, Quilter Cheviot Limited, 31 December 2025. Past performance is not a reliable indicator of future results. The value of investments and the income from them can go down as well as up. You may not get back what you invest.
Not only does the chart above back up the old saying ‘time in the market beats timing the market’, but it also puts that -2.8% gilt return into perspective too. It shows that even during what has been a difficult year, bonds remain useful diversifiers. It follows that were equities to go through a challenging period of their own, bond weightings in a multi-asset portfolio would help to soften any negative impact.
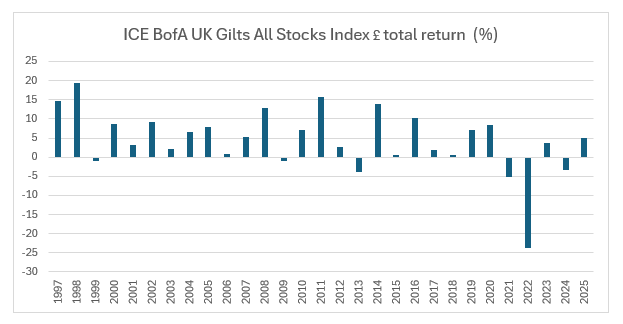
Chart#2: Bonds have historically performed well in times of economic downturns such as the bursting of the dotcom bubble (2000-2002) and the Global Financial Crisis (2007-2008)
Source: Bloomberg, Quilter Cheviot Limited, 07 October 2026. Past performance is not a reliable indicator of future results. The value of investments and the income from them can go down as well as up. You may not get back what you invest.
In other words, bonds continue to offer diversification benefits. One for the bonds doing their job box then.
A perfect storm?
As for why bonds have had a tough time of it lately, there is no shortage of reasons: the US/Iran conflict and resultant surge in energy prices; competitive pressures arising from the huge bond issuance programmes of the artificial intelligence (AI) hyperscalers; high fiscal deficits across the developed world; stubbornly high inflation data; and more robust than expected economic growth. Doubts over the credibility and independence of the Federal Reserve (Fed) haven’t helped either. Throw in US Treasury Secretary Scott Bessent’s failed attempts to bring down yields and describing the current backdrop as something like a perfect storm would appear to be not far off the mark.
The above drivers featured heavily during the third quarter. In August, the US Treasury announced that total national debt had reached US$40tn, drawing attention to the US’ public finances. Later that month, escalation in the Middle East drove a surge in oil prices— Brent crude oil rose 34.8% (US$) in Q3—which reignited inflation fears. And then there was a run of strong economic data, which fuelled expectations that interest rate hikes will be needed to cool the US economy down. At the beginning of September and before the Fed raised rates by 0.25% percentage points, around 0.6 percentage points of rate rises had been priced in over the next 12 months. By the end of September, and following the strong economic data, futures markets were pencilling in 0.9 percentage points of rate hikes over the next year. This is a significant shift from the rate cuts which were priced in at the start of 2026.
The rise in bond yields is therefore arguably no more than what one would have expected against the current backdrop. After all the economy is growing at a fair clip, while inflation and public debt concerns are elevated and more interest rate hikes are expected. Another tick in the ‘bonds doing their job’ box.
Fixed income: It’s all in the name
Whether they are US, UK or German, government bonds promise a fixed return over the remaining life of the bond. Similar to term-based savings accounts, investors lock in a return at the time of purchase. If held to maturity, the bond investor is guaranteed a pre-defined return, just like a savings account.
And here’s the thing. At current levels, short-dated gilts are offering attractive returns at current prices compared to those available on cash.
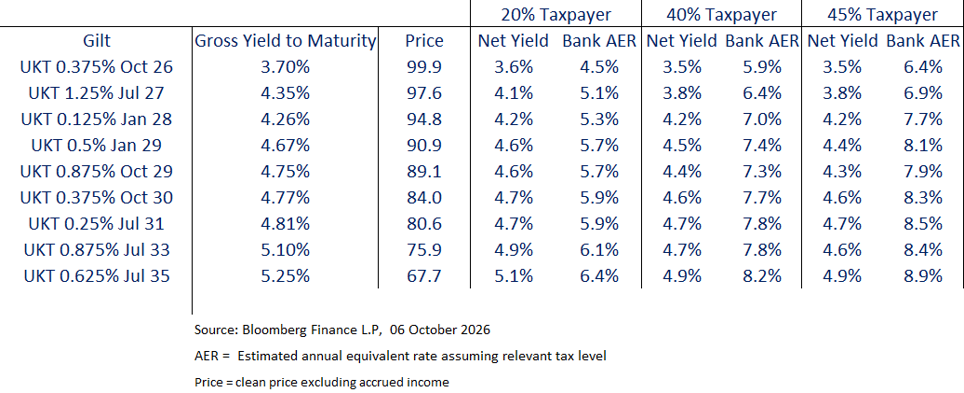
As the table above highlights, gross yields from short-dated bonds (maturities of between zero and five years) of up to 5% match the best deposit accounts on the market. But account for tax, and current cash deposit rates can’t match the net yields on offer from short-dated gilts. Higher rates from cash (the bank annual equivalent rates for each tax band in the table) would be required to equal the returns available on short-dated bonds. That’s because gilt returns have two components: the coupon which is taxed and the capital which is not.
If you would like to know more about our tax efficient short-term bond strategy, please speak to your Investment Manager or Financial Adviser or view our explainer here.
What’s more in today’s markets 1% of interest rate hikes are largely priced into those 5%ish yields. The short end therefore comes with a decent cushion. And with uncertainty surrounding what lies ahead in the upcoming Budget, having such a cushion is no bad thing! The same is true should there be an economic shock and swift downturn in activity, although in such an environment, bonds could be well placed to rally.
Job done?
Government bonds providing diversification benefits; yields rising on the back of a higher growth/higher inflationary environment; short-term gilts offering tax-efficient alternatives to cash—that in a nutshell is why government bond markets today are just doing their job.
Author