2023 was something of a rollercoaster year for investors but ultimately a profitable one, largely thanks to a stellar last couple of months fuelled by moderating inflation and growing expectations of significant central bank interest rate cuts this year. Overall, the year could be characterised as surpassing most expectations for returns, thanks in no small part to these expectations being at extremely pessimistic levels to start with. Last year provided a good reminder of the benefits of remaining invested for the long-term as just when interest rates were peaking around October and moving to cash seemed increasingly appealing, stock and bond markets embarked on a strong rally into year-end that provided double-digit returns.
Rather than banging on at length about what market drivers and returns were last year, here are 8 charts that summarise 2023:
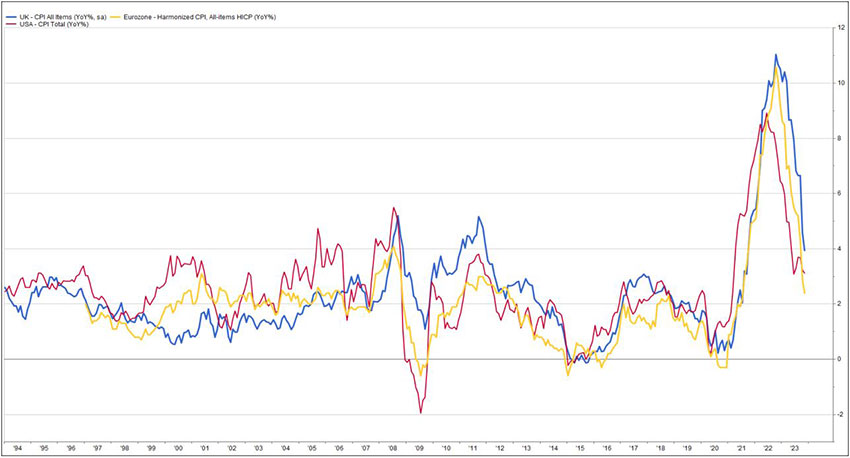
Chart 1: Inflation fell significantly
 Source: FactSet, 3 January 2024
After its rapid rise in 2022, inflation fell markedly in 2023 across the UK, US and Eurozone. Base effects played a part but recent readings suggest that inflation is receding quicker than many had feared. That said, there is still some general concern about difficulties in the “last mile” with many believing returning to 2% could be challenging.
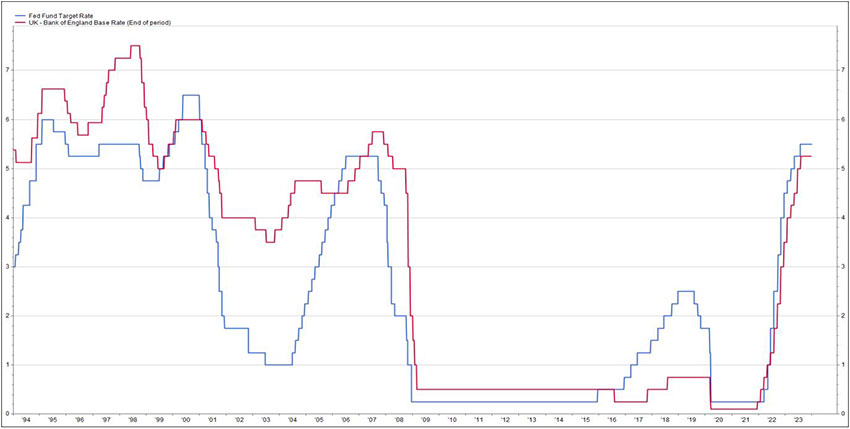
Chart 2: Interest rate rose sharply
 Source: FactSet, 3 January 2024
2023 saw a continuation of one of the fastest interest rate hiking cycles on record, as the Bank of England and Federal Reserve aggressively tightened policy in response to high inflation. Note that current levels are not that unusual on a longer-term perspective and that it appears the rate increases could be over.
Chart 3: Expectations for substantial cuts
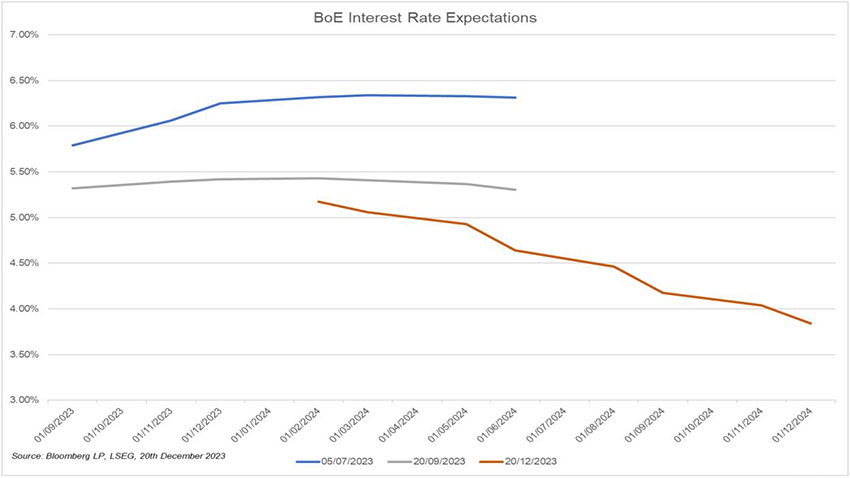
Not only are UK interest rates not expected to rise any further, they are now seen to be falling substantially. These three lines show the evolution of market expectations for future interest rates; the blue line above shows that last summer further increases were expected before a levelling off, the silver line represents the market view in September where rate cuts were first being priced in and the orange line shows the December market view which sees the base rate at sub 4% by the end of 2024. This major “repricing” of the path of future interest rates was the major driver of the positive returns that equity and bond markets saw in the final few months of 2023.
Chart 4: Strong returns into year end
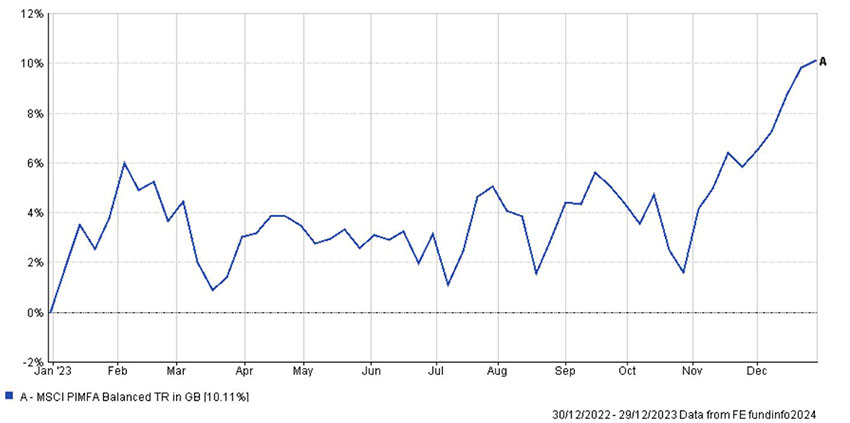
The bulk of 2023 returns occurred in the last couple of months, with a typical balanced portfolio up less than 2% in late October before ending up around 10%. It highlights the importance of discipline and patience as an investor, where returns are rarely linear but instead “lumpy” and often unexpected.
Chart 5: US leader, EM laggard
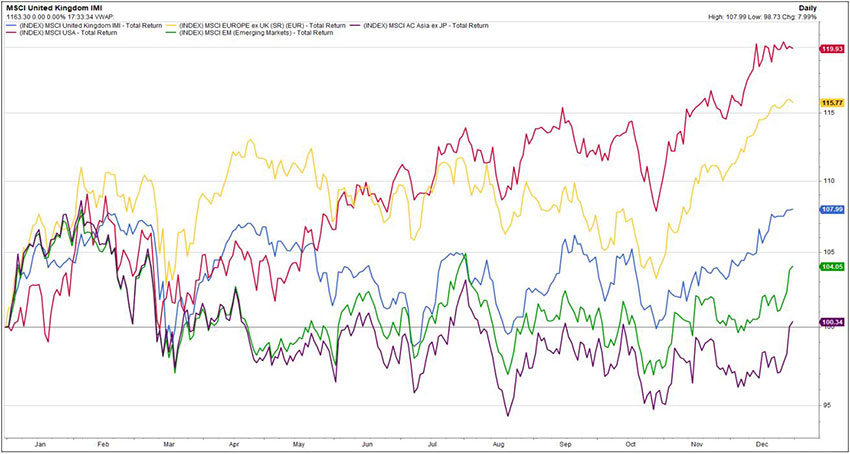
Source: FactSet, 3 January 2024
The US (in red in the chart) was the shining light last year in the equity space, delivering a near 20% total return in Sterling terms, with more than half of this coming in the final couple of months after the Fed “pivot”. Europe (excluding the UK, in yellow) was surprisingly strong too, making a great start to the year before trading sideways for a long period before joining in the year-end rally. The UK (blue) was middle of the pack after outperforming in 2022, but Emerging Markets and Asia ex Japan lagged (green and purple), due in part to China’s slowdown.
Chart 6: The Magnificent 7
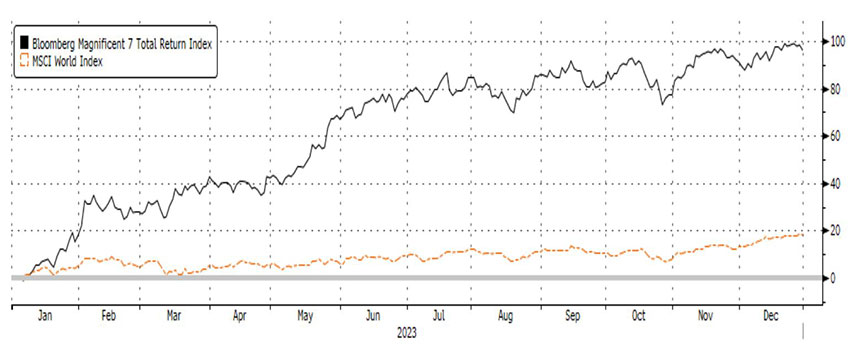 Source: Bloomberg LP, 3 January 2024
A sizable portion of returns in US and even global benchmarks came from the so-called “Magnificent 7” stocks - Alphabet (Google), Amazon, Apple, Meta (Facebook), Microsoft, Nivida and Tesla. As a group they rose around 100% in 2023! These companies hold a collective weighting of around a sixth of the MSCI All Country World Index, a larger proportion than the cumulative weighting for all UK, French, Japanese and Chinese stocks.
Chart 7: Corporate bonds outperform
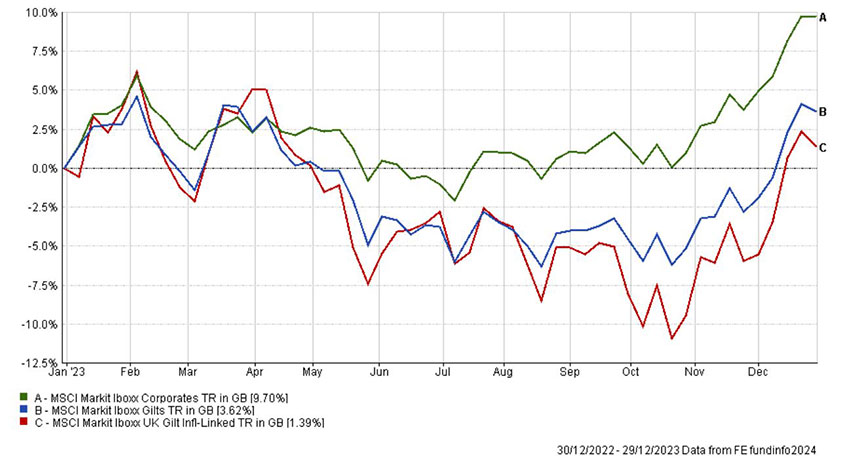
2023 ended up being a positive year for bond markets, as interest rate rises paused and then expectations of cuts began to be priced in. Again, the move into year end did a lot of the heavy lifting as Gilts and “linkers” spent much of the year in negative territory. Corporates did well due to the change in rate environment and also a stronger than expected economy, trading positive for most of the year and ending up with an almost 10% total return.
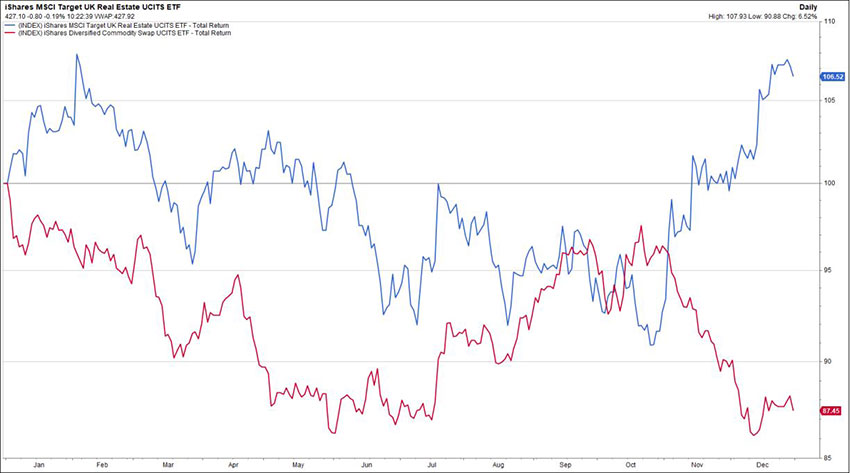
Chart 8: Commodities and commercial property diverge
 Source: FactSet, 3 January 2024
Commodities experienced a reversal in fortunes last year compared to 2022, with an ETF tracking a diversified commodity index spending it almost entirely in negative territory and ending down around 13%. The first three quarters of 2023 saw some correlation between commodities and commercial property but a stark divergence appeared in the final months with the former falling sharply and the latter rallying to end up over 6%.
In sum, it was certainly not an easy year for investors with the siren calls of attractive savings accounts prompting many to question whether cash might be a good hiding place. Ultimately, “balanced” investors saw good returns for the year as a whole, albeit with those returns weighted heavily towards the end of the year and it feels very much like it will go down as a year when the patient were rewarded.
And the prospects for 2024 you ask? We shall just have to wait and see but as ever, it’s unlikely to be plain sailing as the first few weeks of the year have shown. Good luck out there!
This is a marketing communication and is not independent investment research. Financial Instruments referred to are not subject to a prohibition on dealing ahead of the dissemination marketing communications. Any reference to any securities or instruments is not a personal recommendation and it should not be regarded as a solicitation or an offer to buy or sell any securities or instruments mentioned in it
--
The MSCI information may only be used for your internal use, may not be reproduced or redisseminated in any form and may not be used as a basis for or a component of any financial instruments or products or indices. None of the MSCI information is intended to constitute investment advice or a recommendation to make (or refrain from making) any kind of investment decision and may not be relied on as such. Historical data and analysis should not be taken as an indication or guarantee of any future performance analysis, forecast or prediction. The MSCI information is provided on an “as is” basis and the user of this information assumes the entire risk of any use made of this information. MSCI, each of its affiliates and each other person involved in or related to compiling, computing or creating any MSCI information (collectively, the “MSCI Parties”) expressly disclaims all warranties (including, without limitation, any warranties of originality, accuracy, completeness, timeliness, non-infringement, merchantability and fitness for a particular purpose) with respect to this information. Without limiting any of the foregoing, in no event shall any MSCI Party have any liability for any direct, indirect, special, incidental, punitive, consequential (including, without limitation, lost profits) or any other damages. (www.msci.com)
Subscribe to Taking Stock - Diary of an Investment Manager
Get the inside view from Quilter Cheviot Investment Manager, Jonathan Raymond, in his fortnightly diary.