Banks - charts explaining recent performance
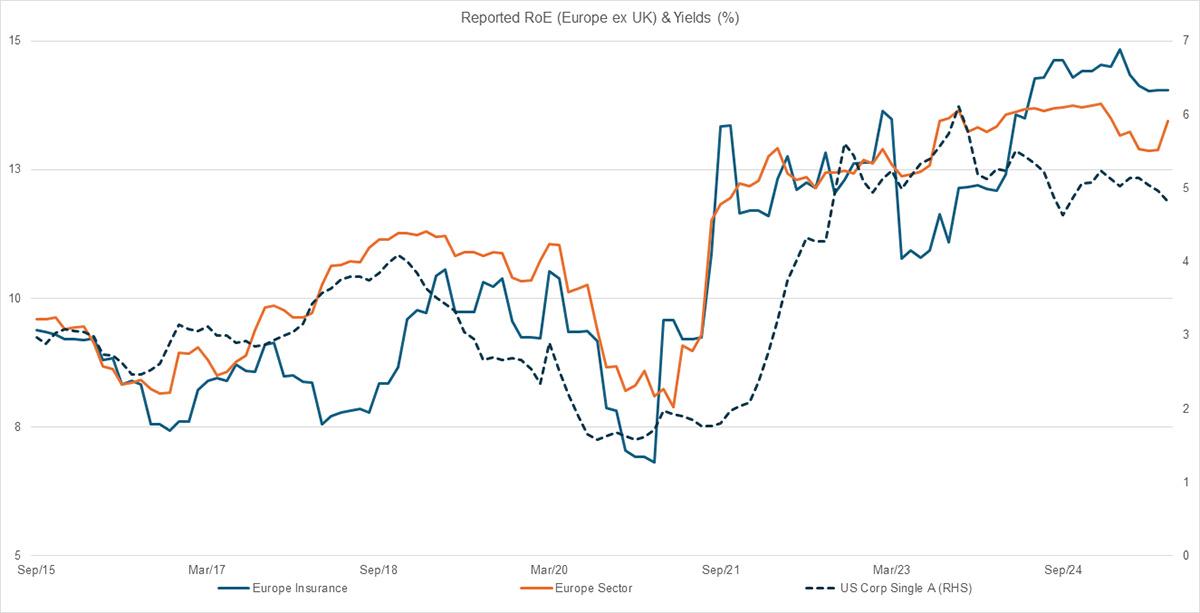
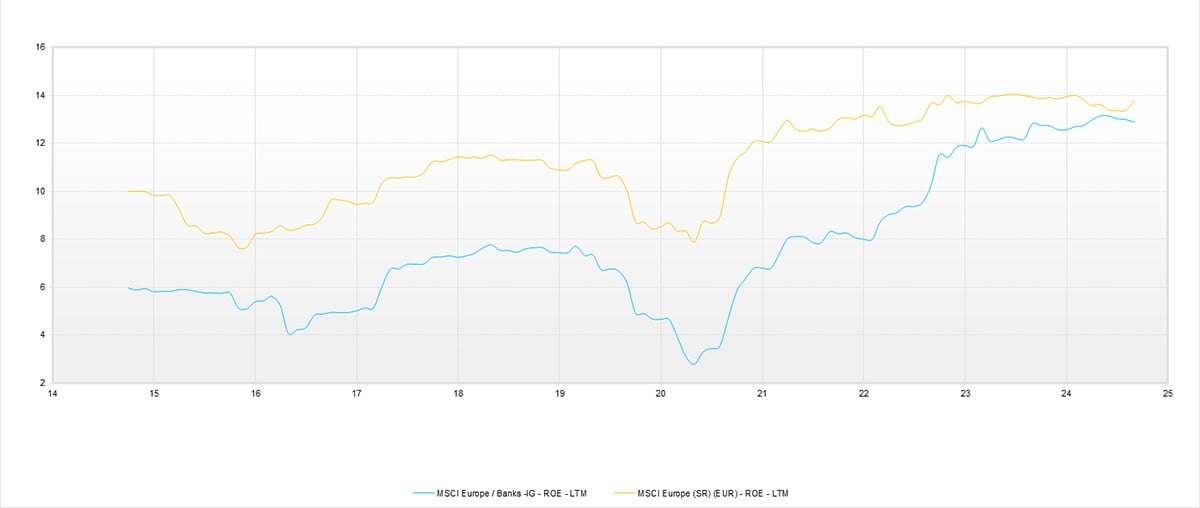
Chart 1: Rising profitability
Source: FactSet, Quilter Cheviot Limited 10/09/2025.
These figures refer to the past and past performance is not a reliable indicator of future results.
Bank profitability has risen sharply in recent years, supported by healthier interest rate spreads and very limited credit losses.
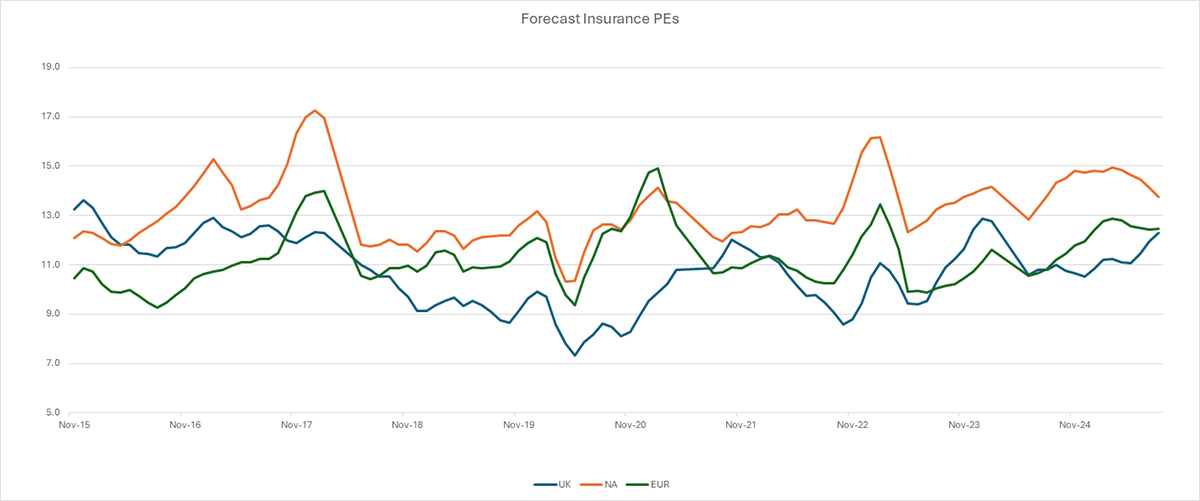
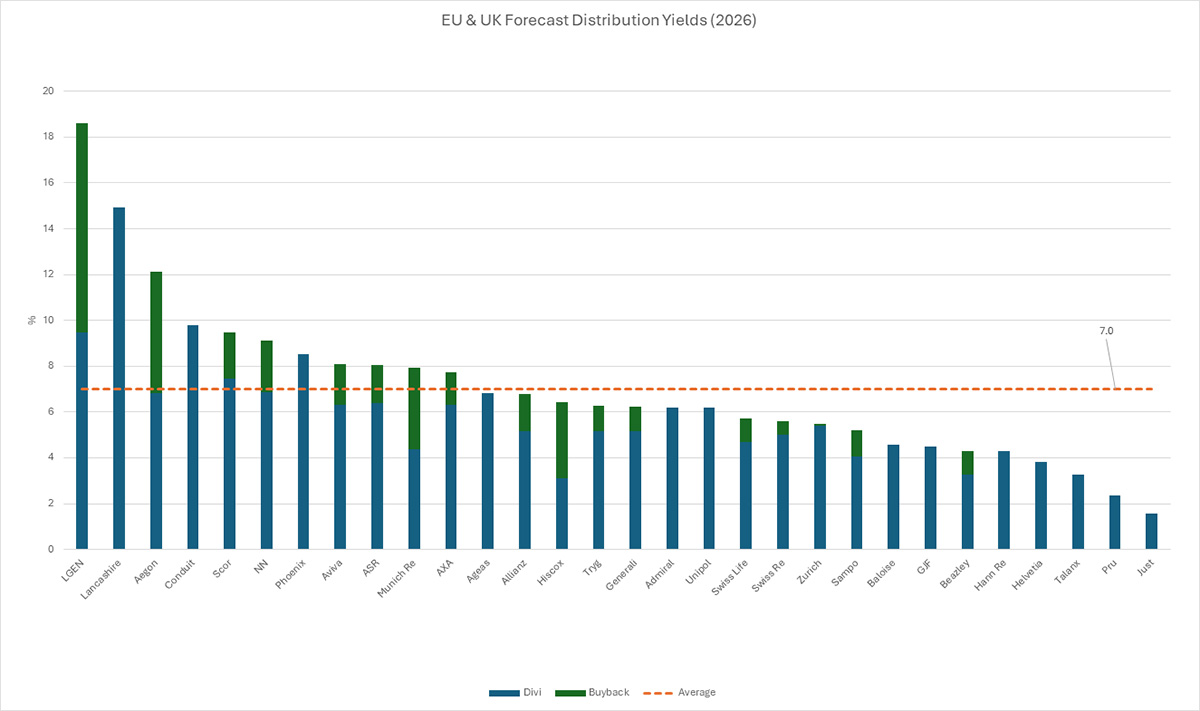
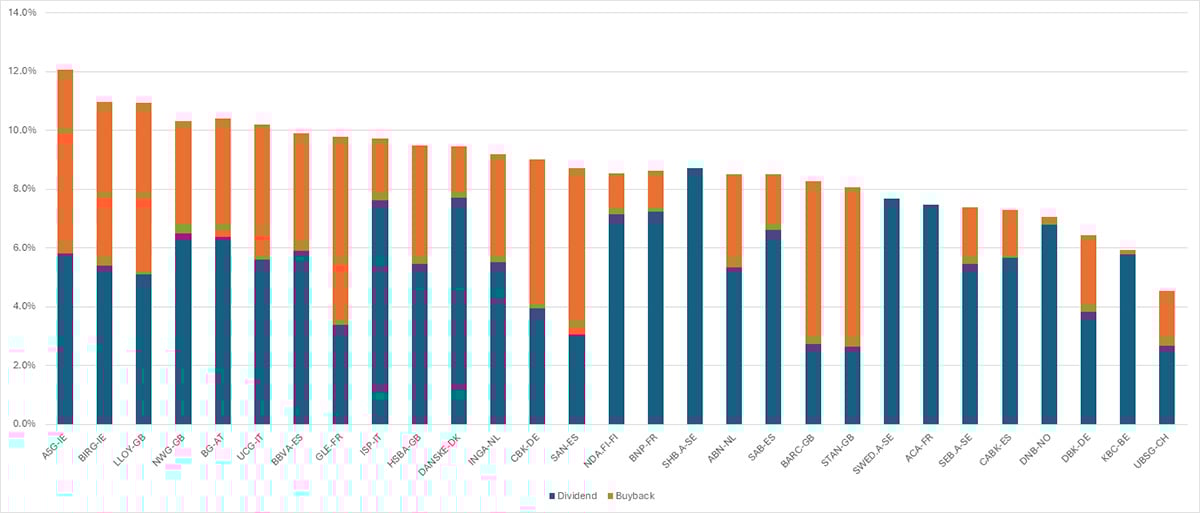
Chart 2: Banks are offering attractive expected distribution yields for 2026
Source: FactSet, Quilter Cheviot Limited 10/09/2025.
These figures refer to the past and past performance is not a reliable indicator of future results. Forecasts are not a reliable indicator of future results.
Strong profitability and relatively limited loan growth to fund has allowed banks to return more capital to shareholders through dividends and buybacks, with the average across European banks being around 9%. We have also seen some banks pay out over 100% of earnings, with regulator approval, which is a positive development as previously, regulators have enforced restrictions in this regard.
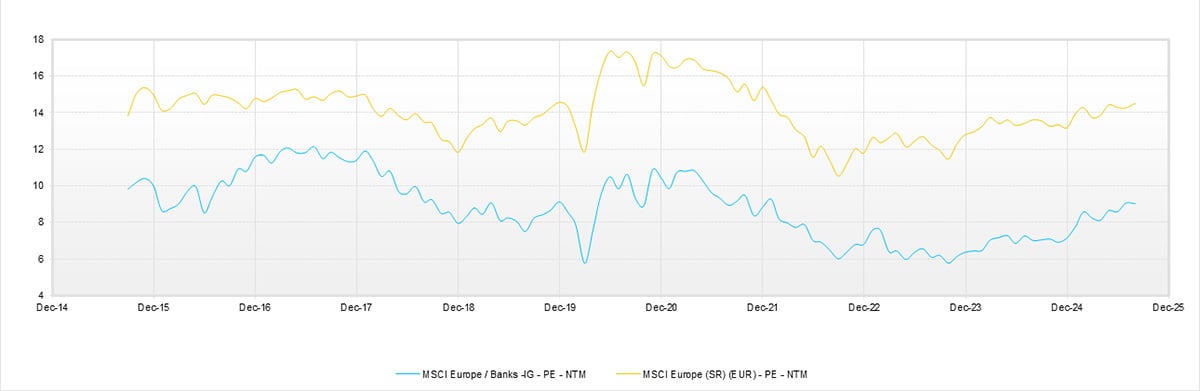
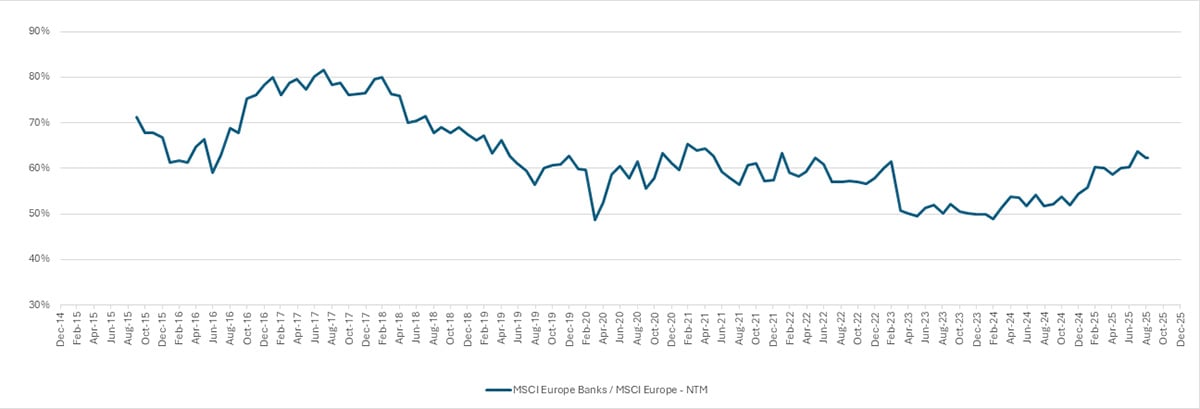
Charts 3: Bank valuations, absolute and relative, are still discounted
Source: FactSet, Quilter Cheviot Limited 10/09/2025.
These figures refer to the past and past performance is not a reliable indicator of future results.
Source: FactSet, Quilter Cheviot Limited 10/09/2025.
These figures refer to the past and past performance is not a reliable indicator of future results.
European banks are trading on cheaper valuations than the broader market. The light blue line above shows that European banks are trading on approximately 9X next year’s earnings estimates compared to roughly 14X for the broader market (yellow line). This is equivalent to a ~38% discount and suggests further re-rating is possible. For example, European banks traded at a 20% discount in 2016-17 when the interest rate environment was much less favourable leading to weaker profitability and capital return.
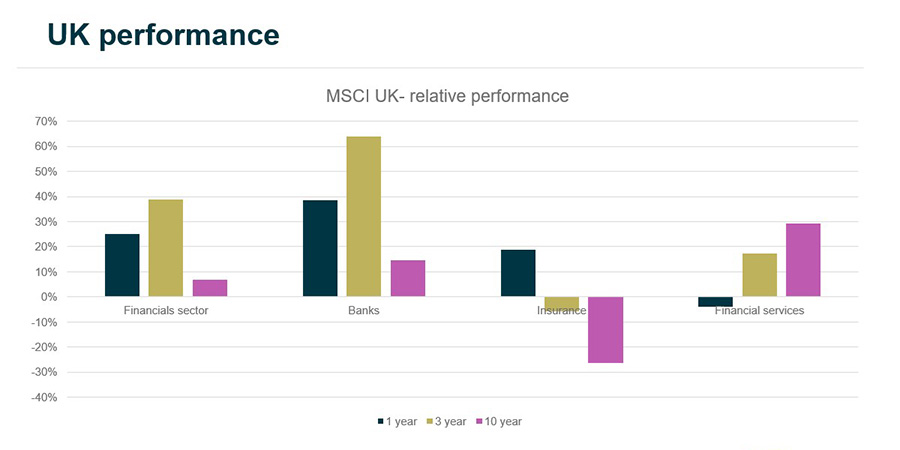
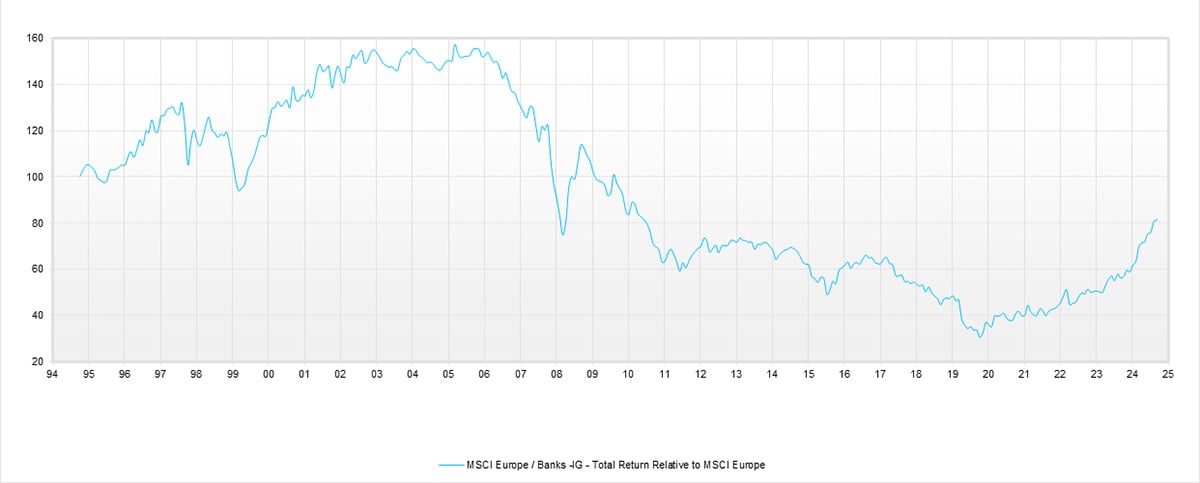
Chart 4: Banks can outperform (and underperform) for long periods
Source: FactSet, Quilter Cheviot Limited 10/09/2025.
These figures refer to the past and past performance is not a reliable indicator of future results.
Looking back at the performance of banking stocks against the broader market, you can see they have outperformed, and underperformed, for sustained periods. Since the Covid-19 pandemic, there has been a strong level of outperformance. Banks also outperformed during the 1990s and most of the 2000s. Leading up to the global financial crisis, banks unsurprisingly underperformed and continued to do so for much of the next decade. This shows that trends can persist for a number of years.